

This article was first published on April 11th, 2022, and was last updated November 2022.
Since Lighthouse emerged as an SEO tool in 2018, it’s been keeping the SEO community buzzing. One ranking factor we know that is becoming more and more critical is page experience. You’ve probably been looking to find a reliable way to measure and track your technical SEO efforts and start ranking faster.
One such tool is Lighthouse SEO. It’s favored by beginner and advanced SEOs alike. In this article, we are aiming to give you a non-technical SEO guide to Lighthouse metrics. We’ll explain each metric simply, without any jargon. You will have a thorough understanding of how Lighthouse performance tracking works and how you can amp up your SEO game. Now, let’s get you up to speed!
Table Of Contents
Testing Performance Using Lighthouse
Lighthouse’s Performance Metrics
- Largest Contentful Paint (LCP)
- Total Blocking Time (TBT)
- First Contentful Paint (FCP)
- Speed Index (SI)
- Time to Interactive (TTI)
- Cumulative Layout Shift (CLS)
What is Lighthouse?
Whether you’re thinking about improving your SEO or your Google Ads game, Lighthouse can serve both purposes well.
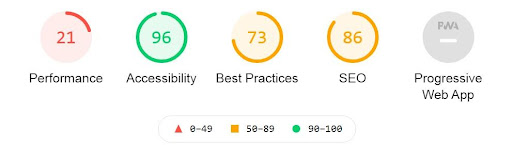
Lighthouse is a tool that audits web pages for:
- Performance
- Accessibility
- Best Practices
- SEO
- … or as Progressive Web Apps
After an audit, you get a full report on how well your page did. You’ll have a clear picture of which technical elements work well and which ones need further improvement. It’s an automated tool, so the full assessment only takes a few minutes.
It’s also an open-source solution which means that any developer can contribute additional features to the core functionalities.
You can run Lighthouse:
- As a Chrome extension – the least technical way!
- In Chrome DevTools
- From the command line via shell scripts
- As a Node module
- From a web UI
Web Core Vitals
The Chromium blog introduced Web Vitals in 2020 (known today as Web Core Vitals). It is an initiative by Google to provide unified guidance for quality signals on websites.
What does this mean? Google wants to help us navigate the world of technical SEO, so they have created a set of metrics. These metrics can be used as a template by webmasters and SEOs to understand and improve a website’s performance.
The Web Core Vitals include:
- Largest Contentful Paint (LCP)
- First Input Delay (FID)
- Cumulative Layout Shift (CLS)
If you regularly check Pagespeed Insights or Google Search Console, you probably have seen these metrics referenced already. We’ll cover them in more detail in the coming sections.
Testing Performance Using Lighthouse
This article will only cover performance testing via the Chrome extension (also available for Firefox). This is the most user-friendly and non-technical way to get a Lighthouse report.
What to Test
If you’re using Lighthouse as is (i.e., the extension), note that it can only audit a single page at a time. The best practice is to test more than one page to gain an understanding of your website’s strengths and weaknesses.
Here’s a short list of important pages to include in your testing, especially if you’re an ecommerce business and want to boost your ecommerce SEO:
- Homepage
- Services or Product listing page
- Cart
- Checkout
- Order confirmation
- Subscribe page
- Blog homepage
Additionally, you can check your Google Analytics to see your most visited pages. Add these to the lineup, as well.
If you want to keep this test non-technical, try to limit your list of pages to 50 or less (or as many as you can handle checking manually). Otherwise, use the Node command line method to gather all the data. This method requires advanced coding knowledge.
How to Test
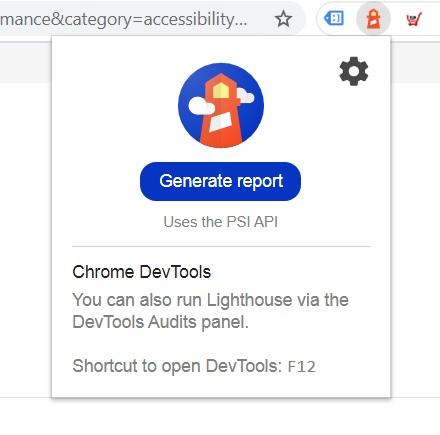
First, download and install the Chrome extension. Then in Chrome, click on Extensions in the toolbar and pin Lighthouse. This will give you quick access to the tool.
- Navigate to the web page you want to test 2.
- Click the Lighthouse icon in the toolbar and click Generate Report.
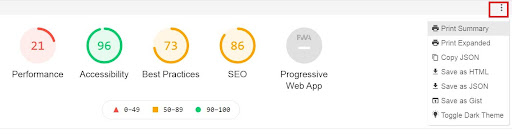
3. In the top right corner of the completed report, click on the three dots and save the report in your preferred format (click on Print Summary to save as a PDF).
To make the most out of your report, get a goal-tracking app ready to go. This is where you can turn performance results into business goals and get a buy-in from all departments.
Lighthouse’s Performance Metrics
On-page user experience is an important SEO ranking factor. It includes everything from speed to accessibility to basic SEO settings being in place. This article focuses on the Performance report and how it affects your search engine optimization (SEO).
Why this report and why not the ‘SEO’ report itself? In most cases that we’ve seen, webmasters score better on the ‘SEO’ report as those include fairly basic settings such as whether a page has a meta description.
The Performance report contains harder to achieve elements (mostly regarding your speed) that impact your SEO just as much. Let’s make some sense of these!
Largest Contentful Paint (LCP)
Simple Definition
Users often say that they want a “fast loading” experience. It just means that they want the most important content to load fast. As long as the most meaningful content appears immediately, users will have the sense that your site is fast.
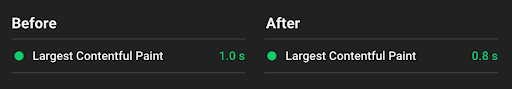
Largest Contentful Paint represents a user’s perception of the loading experience.
What’s a Good Score?

0 – 2.5 seconds.
How to Optimize LCP
1. Fix Slow Server Response Times
Your browser accesses your website via your hosting server. Sometimes the server is slow to respond. This can be fixed by checking if you have any unnecessary queries or running operations in your website’s code.
Other options:
- Route users to a nearby CDN. If your page is hosted on a single server in one geographical location, it will load slower for users geographically farther away.
- Cache assets. Caching means that your browser “remembers” certain elements from a page, and you won’t need to load them every time.
- Serve HTML pages cache-first. Only update the cache when the content has changed.
- Establish third-party connections early. Add rel=”preconnect” to your header to speed up requests to third-party add-ons on your site.
2. Render-Blocking JavaScript and CSS
What’s render-blocking JavaScript and CSS? External stylesheets usually take longer to load. Remove non-critical JavaScript and CSS so that only the minimal amount of resources are loaded.
Your browser accesses your website via your hosting server. Sometimes the server is slow to respond. This can be fixed by checking if you have any unnecessary queries or running operations in your website’s code.
3. Slow Resource Load Times
This refers to slow-loading elements, such as <img>, <image>, or <video>. If your content marketing plan relies heavily on visuals, consider also implementing a step to optimize them. Compressing or resizing images and videos can do the trick.
4. Client-Side Rendering
Client-side rendering means that a site is rendered in the browser rather than on the hosting server. This can slow download times. Try minimizing critical JavaScript and using server-side and pre-rendering. Learn more about this here.
Total Blocking Time (TBT)
Simple Definition
When a user loads a page, it can take a few seconds to become ready to use. This responsiveness is measured by Total Blocking Time.
Imagine having a single-line queue of scripts. Your site needs to load everything through it AND register any input from the user, too.
This is TBT’s formula:
Sum of all periods between First Contentful Paint and Time to Interactive when task length exceeded 50 milliseconds.
More detailed metrics like the TBT are ones that are great to list in SEO proposals. It’s intricate because when this metric needs improvement, the whole developer team is usually brought to the table. You will see why below.
What’s a Good Score?
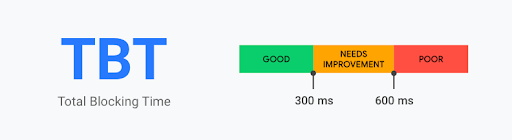
0-300 milliseconds.
How to Optimize TBT
A high TBT score is mostly caused by Long Tasks. These are JavaScript codes that take up loading breadth (i.e., the main thread) for extended periods.
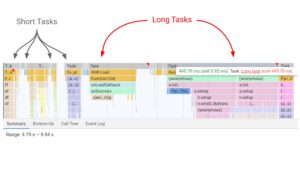
Therefore, what you need to do is optimize your code to run in smaller batches by:
- Code splitting
- Removing unused code
- More efficiently loading third-party JavaScript
During code-splitting, each of your split codes should run in under 50 milliseconds to see improvement on the TBT score.
You can also review any inefficient JavaScript statements in your code that return too many nodes, for example. See more on this here.
First Contentful Paint (FCP)
Simple Definition
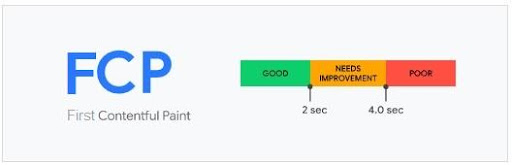
First Contentful Paint marks the time when the first image or text is displayed on a web page. It’s another indicator for the user that the site’s content is almost ready.
If the user perceives your site to load the first image or text too slowly, it can affect your customer satisfaction, user engagement, and even your customer retention.
What’s a Good Score?
How to Optimize FCP
Your first step to optimizing FCP should be reviewing font load time. Why? Fonts are often large files that take a while to load. Additionally, browsers often hide text until the font loads.
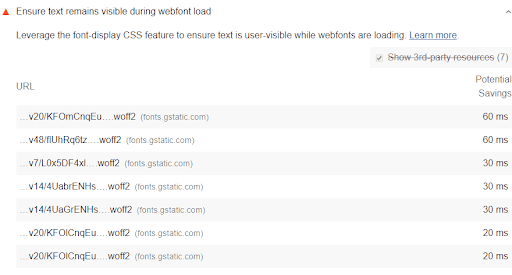
You can dodge this by temporarily showing a system font until your brand font is ready.
External stylesheets are another area where you can improve your FCP. Wherever possible, try to resort to in-line CSS styles, especially for above-the-fold content.
You may even have new lines of code in your CSS. To see what they are, utilize Chrome DevTools’ Code Coverage functionality.
Speed Index (SI)
Simple Definition
The Speed Index captures how quickly the contents of a page are visually displayed. It does so by making a video of the page loading in the browser then evaluates the progression between frames.
What’s a Good Score?
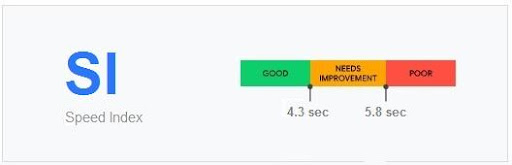
0 – 4.3 seconds.
How to Optimize SI
Speed Index’s purpose is to give you an idea of your page load efficiency in general. This means that anything you improve on your page speed will result in a better SI score, too.
This is a metric that is more important than we think. Today, we know that shaving off seconds and milliseconds of your load time can directly translate to conversion rate improvements.
You can optimize your Speed Index by:
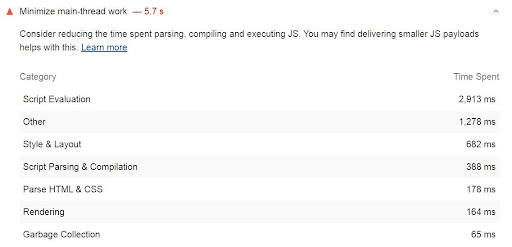
- Doing less main thread work (see explanation under TBT)
- Reducing JavaScript execution time (more info here)
- Reducing font load time (see explanation under FCP)
Time to Interactive (TTI)
Simple Definition
Time to Interactive is the amount of time it takes for a page to become fully interactive. In the previous sections, we talked a lot about appearing to be ready. The TTI metric was designed to ensure content visibility is not the only thing webmasters try to optimize to win users.
This issue regularly comes to the surface in usability testing scenarios—nothing more frustrating than a page that seemingly loads fast but then is unresponsive for additional seconds.
A page is considered to be fully interactive when:
- First Contentful Paint is complete.
- Event handlers are ready.
- The page responds to user interactions within 50 milliseconds.
What’s a Good Score?
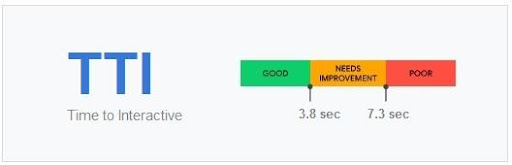
0 – 3.8 seconds.
How to Optimize TTI
Review and remove any unnecessary JavaScript work. Code splitting is the simplest way to reduce large and necessary code-base.
You can also look into the effect that third-party JavaScript elements have on your site. These could include social sharing buttons, video player embeds, chat services, and more. Using them is often unavoidable, though. Here’s what you can do:
- Use a third-party script with the least amount of code.
- Don’t use the same functionality from two different vendors (such as analytics or tag managers).
- Make it a habit to delete unused scripts.
- Use performance budgets via Lighthouse’s LightWallet to keep costs to a minimum (coding knowledge needed).
Additionally, you can do less thread work (see explanation under TBT) and reduce JavaScript execution time (more info here).
Cumulative Layout Shift (CLS)
Simple Definition
You know those times when you are about to read an article, and then the whole content jumps because something else just loaded? Or worse, trying to tap on something on mobile, and
Cumulative Layout Shift measures this same experience. It determines the number of unexpected layout shifts on a page.
These shifts can happen due to any of the following reasons:
- Some assets get loaded late, above the current content
- An image or video loads with unknown dimensions
- A font renders larger or smaller than the system font
- A third-party ad or widget resizes itself
This metric is necessary for user experience but also for developer testing. In many cases, developers are not able to detect these issues when doing the testing themselves.
Why? For example, test images may already be in a dev’s browser cache, so loading is faster and uninterrupted.
What’s a Good Score?
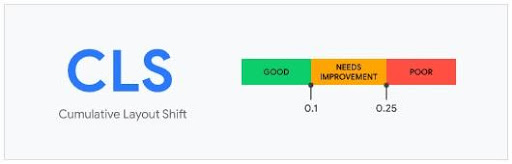
Less than 0.1.
How to Optimize TTI
- Preload fonts
- Always add size attributes to your image and video elements
- Never insert content above existing content
- Reserve space for ads

Building on Your SEO
We can conclude that Lighthouse is an exceptionally great tool for SEO. It helps you quantify performance and speed metrics through a standardized method. Working these scores into your processes can earn you:
- Stakeholder buy-in (easier to convince executives about SEO issues)
- Increases in conversions
- A better user experience
- A simpler way to track and monitor your website
Go right ahead and start testing your pages via Lighthouse! To build on your SEO, learn more how Boostability can be your white label SEO partner.