
6 Google Analytics Metrics You Need to Keep an Eye On

Knowing how your website is performing is absolutely mission critical for any business online – which is why Google Analytics is such an important tool for marketers and small business owners.
The problem is, it can get pretty overwhelming. GA collects a lot of data and you can manipulate and display that data in just about any way you’d like. It’s easy to get lost and distracted by fancy reports that don’t mean much.
But if you know where to look, there are a handful of pre-built reports in Google Analytics that can give you a lot of insight without too much digging. If you monitor and improve these six metrics consistently, you’ll be on the right track to grow your business and leave the competition in the dust.
Here are the six Google Analytics metrics you need to keep an eye on:
-
Sessions
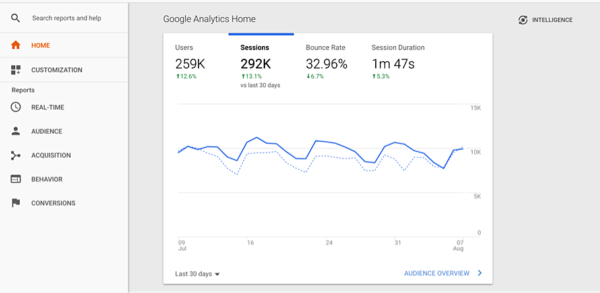
More traffic is always good. Sessions represent the number of times that someone visited your website. If they’re inactive for more than 30 minutes and come back, it’ll be counted as a new session. This makes sessions the most straightforward way to measure site traffic.
While sessions shouldn’t be your ultimate goal, it’s an important place to start for almost any business model and increasing it should be a high priority.
If you’re focused on SEO, there is some evidence that influxes in traffic (increased sessions) are correlated with higher ranking. That’s why it’s one of the first metrics Google shows you when you log into your dashboard:
-
Users: New vs. Returning
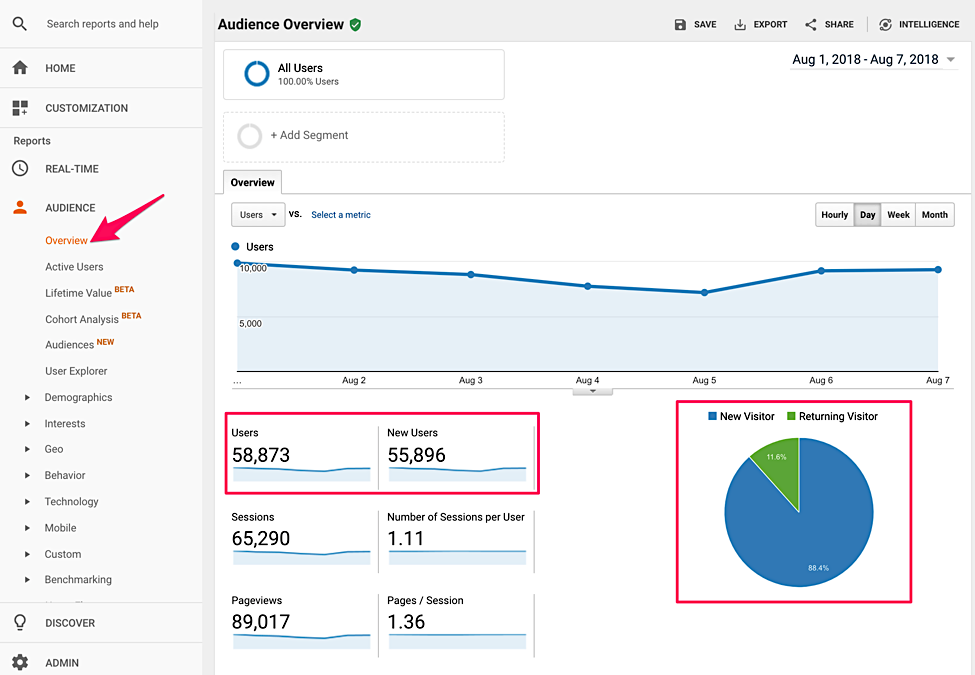
The next most important metric is users. This tells you the number of unique users that accessed your site within the range that you’re looking at.
Note that if the same person accesses your site from multiple computers, each will be counted as a new user. But unless they clear their browser cookies, they’ll only be counted once for each device.
That’s the main difference between users and sessions: a low users-to-sessions ratio indicates that the same visitors came back frequently within the timeframe you’re studying.
But what’s even more useful is the New-vs-Returning ratio and the easiest place to find that is in the “Audience Overview”:
There isn’t necessarily an ideal ratio for this metric, but it can be very informative.
A low proportion of returning users means that most of your traffic is coming from people who just discovered your site. This is fairly common, especially if you’re investing in marketing and SEO. As your traffic grows, it makes sense that most of them will be new users.
But if it’s too low (usually less than 10-15%, but varies by industry), that is a bad sign. It means that people aren’t returning to your site. If that’s the case, you should focus on retention and making your site more “sticky.”
On the flip side, if your proportion of returning visitors is very high (more than 30%), you should probably focus on more marketing and promotion efforts. People are loving your content, but it looks like you’re having trouble reaching new audiences.
In short:
- There is no “ideal” ratio, as it varies from business to business.
- The higher your proportion of returning visitors, the more you should focus on promoting to new audiences.
- The higher your proportion of new visitors, the more you should focus on user retention.
-
Goal Conversions
Most sites hope that users will do something other than just visit – usually, buy something or subscribe to an email list. Even if you’re running a blog funded by advertising, you probably want users to subscribe to your newsletter or follow you on social media.
Goal conversions let you know how your site is performing with respect to those key business goals. There are many different types of goals you can set up that vary widely from business to business. Google has some detailed documentation on setting them up here.
To see a high-level view of your goals’ performance, you can view Conversions > Goals > Overview:
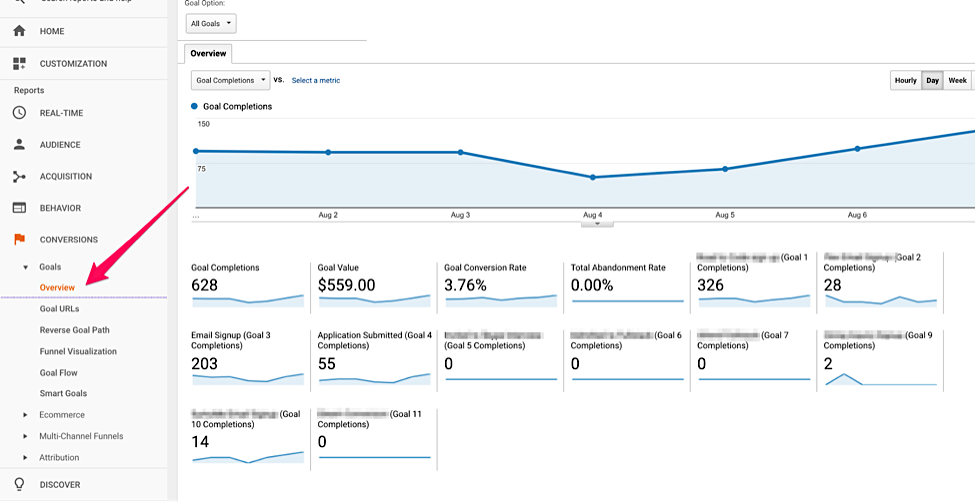
Additionally, a few of the reports I’ll discuss below will include a column for goal conversions that you can customize.
-
Bounce Rate
You should keep an eye on bounce rate, but this metric is also pretty misunderstood and overemphasized.
Your bounce rate represents the proportion of single-page visits you receive. In other words, the user started a session by visiting your site and then left without clicking through to any other pages.
Obviously, that doesn’t sound great. We want users to read multiple articles or check out our products and services.
But it’s not always bad either. For example, if customers come, read your blog article, opt in to your newsletter popup and leave, is that so bad? Or if customers land on your contact page, give you a call and close the website, is that a failure? Sometimes a high bounce rate means that your site is doing its job very well!
There are two things to watch out for:
- An unusually high bounce rate (compared to industry benchmarks) that isn’t expected or explained
- A large change in bounce rate over any amount of time
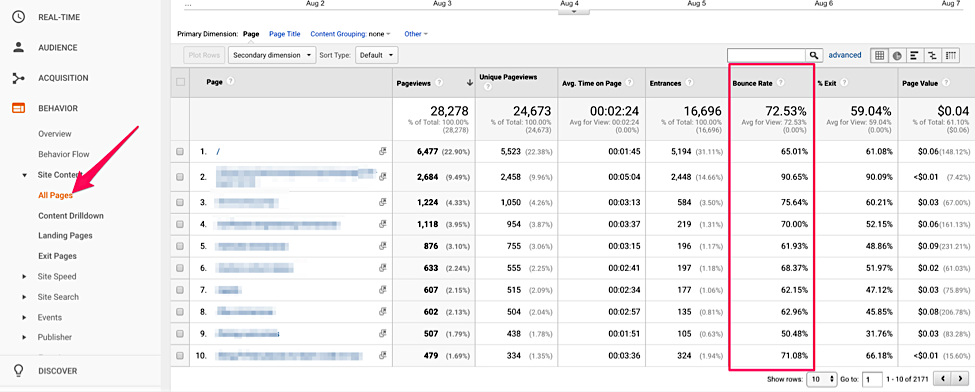
A large increase in bounce rates means that you might be doing something to annoy users and discourage them from staying on your site.
A sharp fall could also mean that your site is doing something to confuse users, making it hard for them to find what they need.
You can find your sitewide bounce rate on the homepage, but you can also find page-specific bounce rates under Behavior > Site Content > All Pages.
-
Traffic Sources
This next metric is a bit more qualitative. It tells you where your users are coming from.
Most sites will see that their traffic is categorized as one of the following:
- Organic Search
- Direct
- Referral
- Social
- (Other)
For sites with more marketing funnels, you might see some others or you might have created custom groupings like:
- Paid Search
- Paid Social
- Display
To see these broad categories, head over to Acquisition > All Traffic > Channels:
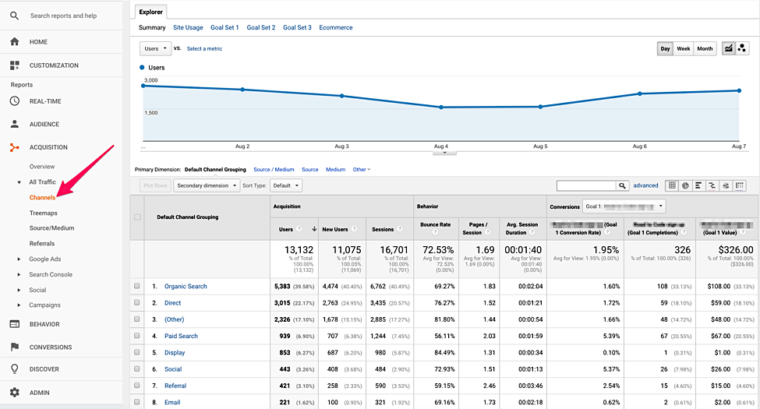
This tells you how each category is performing: how much traffic is it bringing in, how is that traffic behaving, and, most importantly, is it converting?
It will give you an idea about the results that your different marketing efforts are getting so that you can determine ROI. This should help you decide where to focus going forward.
Of these columns, the most important are Sessions & Conversions – which channels are driving traffic and which are making sales. Double down and focus your efforts on those.
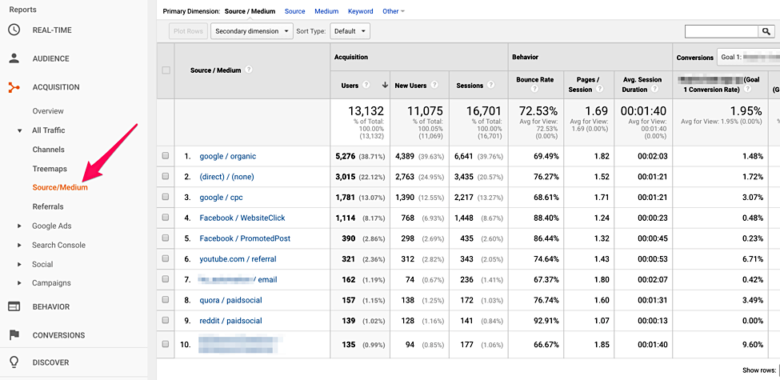
If you want to drill in further and learn about which sites or campaigns are performing within a category, you can just click on it. To compare them side-by-side, go to Acquisition > All Traffic > Source/Medium:
-
Top Landing Pages
Where traffic sources tell you where traffic is coming from, top landing pages will tell you where they first arrive on your site.
This gives you some powerful insights:
- Focus your content strategy around important pages that are drawing the most attention
- Invest resources in optimizing these pages for improved conversion rates
- Invest resources in lowering bounce rates to drive traffic to the rest of the site
- Add links on popular landing pages to drive traffic and link authority across high-value pages on your site
You can also work backward by sorting your top landing pages by conversion rate to learn what makes them so effective and then develop strategies to drive more traffic to them.
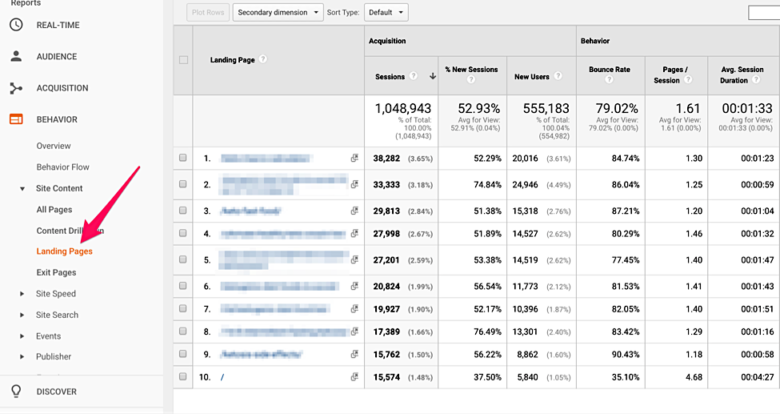
You can see this data under Behavior > Site Content > Landing Pages:
Conclusion
There is tons of useful data inside Google Analytics and as your company grows you can add and remove a few key metrics as needed. But in my experience running a digital marketing agency, these are usually the best metrics to start with if you haven’t already.
Keeping an eye on your sessions, users, and bounce rates will give you a good idea about how people are interacting with your business online. Tracking conversions along with top sources and landing pages will give insight on how to improve those numbers.