
Google Analytics Reports You Can Pull in 10 Seconds
Navigating the world of website analytics can feel daunting, especially with the shift from Universal Analytics (UA) to Google Analytics 4 (GA4). If you're a small business owner in the US, perhaps a millennial or older, you're likely passionate about keeping up with the latest trends and committed to learning what's necessary for your business to thrive online. You've probably heard the buzz about GA4, but maybe feel like it's a whole new language.
Here’s the good news: while GA4 is different, it's packed with powerful features that can offer incredibly valuable insights into your website's performance and your audience – and you absolutely don't need to be a data scientist to benefit from them! Think of this as your practical guide to navigating these updates.
For small business owners like you, understanding how visitors interact with your site is key to making smarter decisions, improving user experience, and ultimately, growing your business. This guide covers four actionable insights you can quickly gather from GA4, along with supporting tools and explanations. We'll show you where to look, what it means, and how to use this information to your advantage. Even if you have very little to no prior knowledge of GA4, this guide is designed to be clear and helpful.
Read more: Guide to Google Analytics' Key Definition
Quick Reference Table: What You’ll Learn

1. Check Your Page Load Speed & Get Actionable Suggestions
Why It Matters
Page load speed is critical for a positive user experience and for SEO (Search Engine Optimization). In simple terms, if your website loads slowly, visitors get frustrated and are more likely to leave – this is called a bounce. Google, and other search engines, notice this and it can hurt your website's ranking, making it harder for potential customers to find you. Fast-loading pages, on the other hand, keep visitors happy and engaged, which search engines love.
The Shift in GA4
GA4 no longer has a dedicated "Site Speed" report like Universal Analytics (UA) did. While you can track page speed metrics through custom event tracking in GA4, the fastest and easiest way to diagnose and improve your site's speed is by using Google PageSpeed Insights. This free tool is specifically designed by Google to tell you how fast your pages load and, more importantly, why and how to make them faster.
Your 10-Second Report: Using Google PageSpeed Insights
- Visit Google PageSpeed Insights: Just search for it on Google, it's a free, official tool.
- Enter your page URL and hit "Analyze": Simply paste the web address of the specific page you want to check (e.g., your homepage, a popular product page).
- Review the results for mobile and desktop: The report will show you how your page performs on different devices. Since most people browse on their phones, pay extra attention to the mobile score!
- Focus on the "Opportunities" and "Diagnostics" sections: These sections are your goldmine! They provide specific, actionable recommendations on what to fix. Don't worry if some of the terms sound technical; the key is to know these sections tell you what to do.
What to Do With This Data
- Prioritize Opportunities: These are actionable suggestions like "Eliminate render-blocking resources." This often means your website is trying to load too many things at once, making it slow. These suggestions tell you how to streamline that process.
- Tackle High-Impact Fixes First: Look for suggestions that will save the most loading time. You want the biggest bang for your buck, especially when you're managing your own site!
- Check Regularly: Especially after making any changes to your website (like adding new images or plugins), it's a good idea to re-check your page speed to ensure your efforts have paid off and haven't introduced new issues. Consistent monitoring is key for good SEO.
Core Web Vitals: Performance Benchmarks Explained
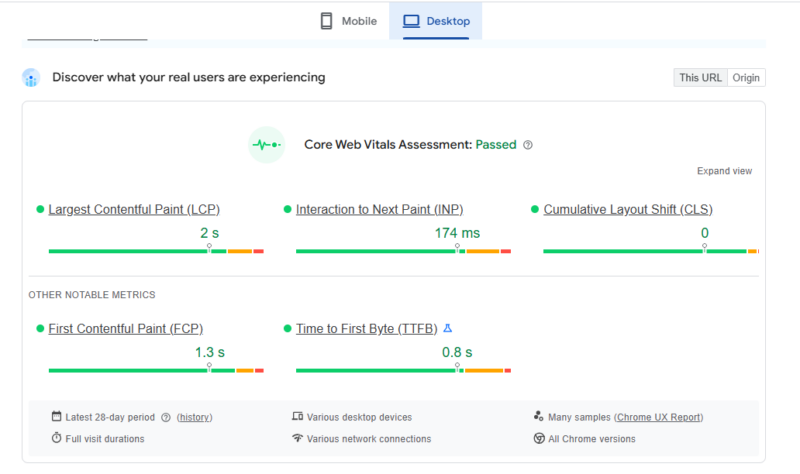
Core Web Vital Assessment Sample
To understand speed in context, Google uses Core Web Vitals. These are a set of specific metrics that measure real-world user experience for loading performance, interactivity, and visual stability. Think of them as Google's report card for your website's user experience. Meeting these benchmarks is crucial for good SEO and keeping your visitors happy.

Additional important metrics (you'll see these in PageSpeed Insights too!):
- First Contentful Paint (FCP): Time it takes for the browser to render the very first bit of content. (Ideal: <1.8s)
- Time to First Byte (TTFB): How long it takes for your website's server to respond to a request from a user's browser. (Ideal: <0.8s)
These values come from the Chrome UX Report, which is based on real user experiences. This means Google is looking at how actual people interact with your site, not just theoretical lab tests.
2. Quickly Understand Who Your Website Visitors Are
Why It Matters
Knowing your audience is like having a superpower for your marketing. It helps you:
- Confirm you’re reaching the right people: Are your marketing efforts bringing in your ideal customers in the US? For example, if you sell artisanal coffee beans, are you attracting coffee enthusiasts or just general browsers?
- Customize content and messaging: Tailor your website copy, blog posts, and product descriptions to resonate directly with your audience. If you know your audience is primarily in their 40s-50s, your language and offers might differ from those targeting Gen Z.
- Make better ad targeting decisions: Spend your advertising budget more efficiently by targeting the people most likely to be interested in what you offer, rather than broad, less effective campaigns.
How to Access It
In GA4, go to Reports > Demographics > Overview. Here, you can explore various aspects of your audience, including age, gender, language, location (down to cities in the US!), and interests. You can also use sub-reports like "View age groups" to dive deeper into specific segments.
Prerequisites to See the Data
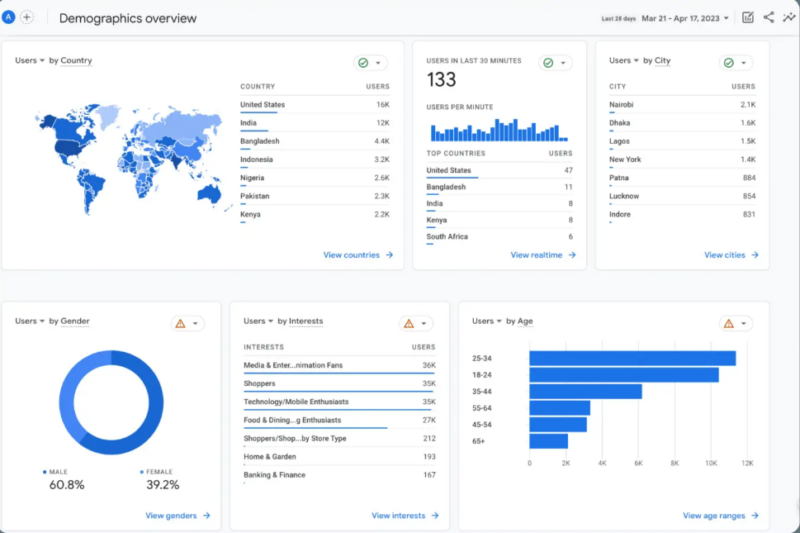
GA4 Demographic Overview
- Enable Google Signals: This is crucial! You can find this setting in Admin > Data Settings > Data Collection. Google Signals allows GA4 to collect more detailed demographic and interest data from users who are signed into their Google accounts and have ads personalization enabled. It helps paint a fuller picture of your audience.
- Traffic Thresholds: To protect user privacy, GA4 might hide very small segments of data. This means if you have very few visitors in a specific demographic, GA4 might not display that information. Don't worry, this is standard practice.
What to Do With This Data
- Verify Your Audience: Is your actual audience matching your intended demographic? If not, you might need to adjust your marketing strategy or even your ideal customer profile. For example, if you thought your primary customer was young professionals in California but GA4 shows more retired individuals in Florida, that's a big insight!
- Create Targeted Content: If you see that a particular age group, gender, or location is dominant, create content specifically for them. For example, if many visitors are from Texas, you might write blog posts relevant to local Texas events or specific regional interests.
- Improve Ad Strategy: Use these insights to refine your targeting on advertising platforms like Google Ads or Meta Ads. This ensures your valuable ad spend is reaching the people who are most likely to convert into customers.
3. Identify Your Most Popular Content (and Where Users Engage)
Why It Matters
You need to know which content truly resonates with your users so you can:
- Replicate successful formats: If a certain type of blog post, product page, or "how-to" guide performs exceptionally well, create more content in that successful style or on similar topics. This is about working smarter, not harder!
- Improve underperforming content: Identify pages that aren't engaging users and figure out why. Is the content unclear? Is the design confusing? Is it simply not relevant to what your audience is searching for?
- Guide internal linking and calls to action: Use your high-performing content to drive traffic to other important pages on your site, like your main services page or an email sign-up form.
Where to Find It
Navigate to Reports > Engagement > Pages and Screens. This report gives you a clear overview of how your individual pages (and app screens, if you have an app) are performing.
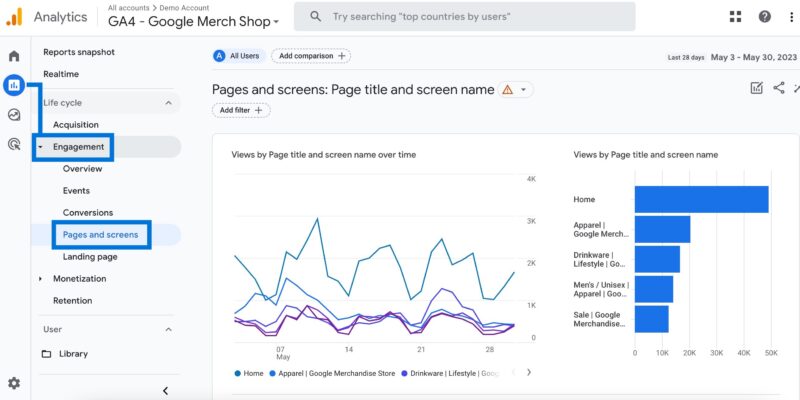
Pages and Screens
Key metrics you'll find here include:
- Views: The total number of times a page was viewed.
- Users: The number of unique people who viewed the page.
- Avg. engagement time: The average amount of time users spent actively on that page. This is a key metric in GA4 for understanding true engagement.
- Event counts: This can include various interactions like clicks, scrolls, video plays, etc., depending on how your events are configured. (Don't worry too much about "events" right now, just know they show interactions).
- Conversions (if configured): If you've set up specific actions as conversions (like a purchase, a form submission, or a "contact us" click), you'll see how many conversions each page contributed to. This ties your content directly to business goals!
What to Do With This Data
- Spot Top Performers: Easily see which pages are getting the most attention and engagement. These are your winners! What do they have in common? Can you create more like them?
- Optimize Weak Pages: Look for pages with high views but low engagement or conversions. These are prime opportunities for improvement. Maybe the content needs to be clearer, the call to action is missing, or the information is outdated.
- Link Intelligently: From your high-traffic pages, add internal links to related, but perhaps less visited, content or to your core product/service pages. This helps guide visitors deeper into your site and discover more of what you offer.
For Visual Engagement (Click Heatmaps)
If you miss the old "In-Page Analytics" overlay from Universal Analytics that showed clicks directly on your page, you have excellent alternatives that provide a visual representation of user behavior:
- Microsoft Clarity (Free): Offers heatmaps (visual representations of where users click, scroll, and move their mouse) and session recordings (actual video playbacks of anonymous user sessions). This is a fantastic free tool for seeing exactly how people interact with your pages.
- Hotjar (Free tier): Provides heatmaps and other user feedback tools like surveys and polls. The free tier is great for getting started and gathering qualitative insights.
4. Understand How Users Navigate Through Your Site
Why It Matters
Mapping out user journeys helps you:
- Discover popular paths: See the common routes users take through your site. For example, do they typically go from your blog post to a specific product page?
- Uncover drop-off points: Identify exactly where users are leaving your site. This could indicate a confusing step, a broken link, or simply that the page didn't meet their needs. Fixing these can drastically improve your conversions.
- Improve flow toward key actions: Optimize the steps users take to achieve your most important goals, like making a purchase, filling out a contact form, or signing up for your newsletter.
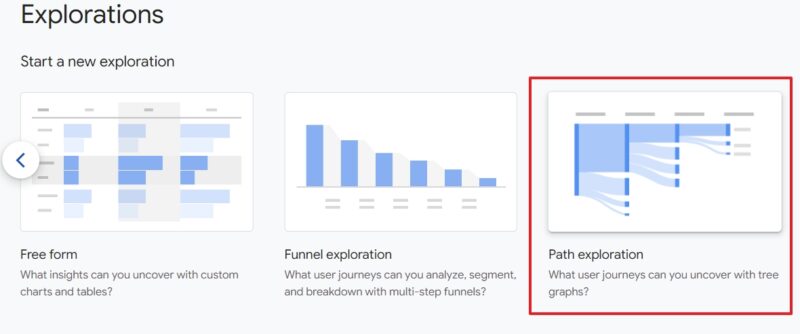
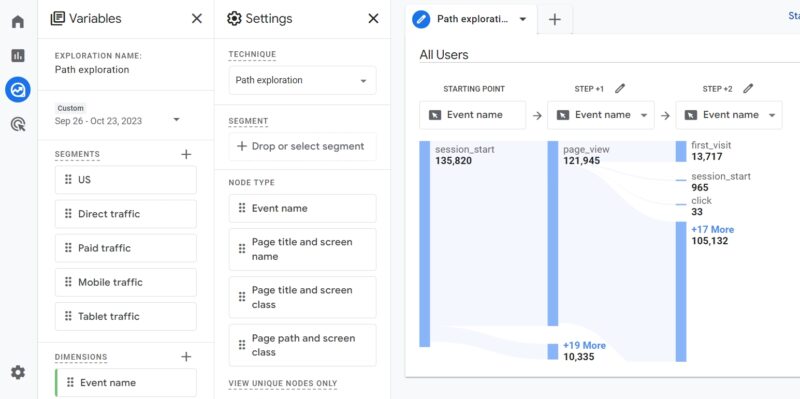
How to Access Exploration Tab
How to Do It in GA4
Go to Explore > Path Exploration. This is a powerful feature in GA4's "Explorations" section that allows you to visualize user journeys. It might look a bit different if you're used to UA's "Behavior Flow," but it's more flexible.
- Choose a starting point: You can begin your exploration with a specific page (like your homepage or a landing page for an ad campaign) or an event (like a "product view" or "add to cart").
- GA4 will show where users go next: Click to expand the path and see the subsequent pages or events. You can build complex paths to understand multi-step journeys.
Quick Tip for Busy Owners: Setting up a new Path Exploration can take a little time to get familiar with. However, once you've configured one that's useful, you can save it. This means you can quickly reuse it later to check trends without starting from scratch, saving you valuable time.
Alternative (Faster Insight)
For a quicker, though less detailed, insight into navigation:
- Go to Reports > Engagement > Pages and Screens.
- Look at high-traffic pages that have low engagement or unusually high exit rates. This could indicate a potential drop-off point where users are abandoning their journey. If lots of people are landing on a page and then immediately leaving, that page might need some attention.
Bonus: Use Funnel Exploration
For a step-by-step analysis of a specific process (like a multi-step checkout flow, an application process, or a lead generation form), use GA4 Funnel Exploration.
- This requires some initial setup to define the exact steps in your funnel.
- Once set up, it provides rich insights into where users are dropping off in a multi-step process, allowing you to optimize each step to improve your conversion rates. For example, if many people abandon their cart on the shipping information page, you might need to make that step simpler or offer more shipping options.
What to Do With This Data
- Reduce Drop-Offs: If you identify pages where many users are leaving, investigate why. Is the content confusing? Is there a broken link? Are shipping costs unexpectedly high? Improve the design and messaging on these "exit-prone" pages.
- Enhance Navigation: Smooth out the user flow to your key goals. Make it easier and more intuitive for users to get from content to conversion. This might mean adding clearer calls to action or improving your internal linking structure.
- Tailor Content Paths: Use insights to create logical content clusters and strategic Calls to Action (CTAs). For example, if many users read a specific blog post, ensure there's a clear CTA on that post to a relevant product or service page.
Summary: Turn GA4 Data Into Growth
Google Analytics 4 may seem complex, but these four focus areas give you a powerful head start in understanding and improving your website:
- Speed affects your SEO (how easily you're found on Google!) and keeps visitors on your site.
- Audience data sharpens your messaging and ensures your marketing reaches the right people in the US.
- Content engagement highlights what’s truly working for your audience.
- User journey analysis helps you optimize your site to boost conversions and reduce frustration.
Regularly checking these metrics helps you evolve your site and strategy. It empowers you to make informed decisions for your small business.
Feeling overwhelmed or just need to accelerate your results? While this guide empowers you to do it yourself, sometimes you need extra horsepower. Our SEO and analytics experts specialize in helping US small businesses navigate the complexities of online visibility. We can help you dig deeper into your GA4 data, set up advanced tracking, and, most importantly, develop an SEO strategy that gets your website on page 1 of Google.
Contact Boostability's Experts Today for a Free Consultation!
Curious about your website's current SEO health?
Get an instant snapshot of your site's performance with our Free SEO Score analysis!
Are you an agency looking for a reliable SEO partner? Boostability also offers top-quality white label SEO services. Partner with us to provide exceptional SEO solutions to your clients without the overhead.
Visit our Partner Page to Learn More about our White Label SEO Program!